
What is GIS?
GIS (Geographic Information Systems) is a technology that allows for the management, analysis, and visualization of geographic data. It combines data from various sources, such as maps, satellite imagery, and statistical data, to create a comprehensive view of a specific location or area. GIS can be used for a wide range of applications, such as land-use planning, natural resource management, transportation planning, and emergency response.
Geospatial In simple terms, geospatial information is geography and mapping. It is “place based” or “locational” information. It is data tied to and portrayed on a map. Today, a map is no longer something you fold up and put in the glove compartment of your car.

Panji Brotoisworo
Geo Spatial Python Developer | Geospatial Analyst | GIS Developer | Researcher | Remote Sensing
I'm a researcher and an experienced Python developer with a focus on data analysis, data wrangling, GIS, and imagery analysis. I develop back end workflows that can automate specific and technical workflows for end users. I am flexible in my solutions and can deliver outputs using licensed software such as ArcGIS or free open source solutions.
My professional experience includes ground deformation or infrastructure monitoring using radar remote sensing (InSAR) but I have also performed analyses on urban cover, irrigation monitoring, and agricultural monitoring. However, I practice machine learning in my personal projects that involve satellite image classification.
I have publications in the fields of traffic safety and satellite image processing and am an active contributor to open source research projects and communities.
Visit my Github for my coding portfolio and contributions:
https://github.com/pbrotoisworo
Recent Posts
- All
- Coding
- GIS

Python and PyInstaller — Introduction and Troubleshooting
Note: Originally posted on my Medium blog. Compiling Python code involves transforming your Python code from a .py file extension to a…
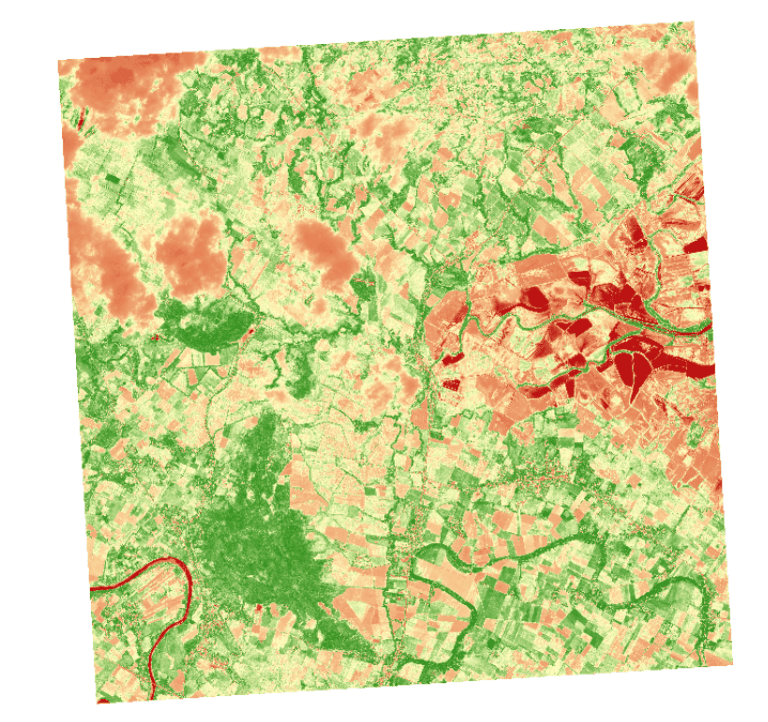
Building a Rasterio Workflow for Your Project
Note: This was originally posted on my Medium blog. A big tool in your remote sensing toolbox Working with geospatial raster data using a…
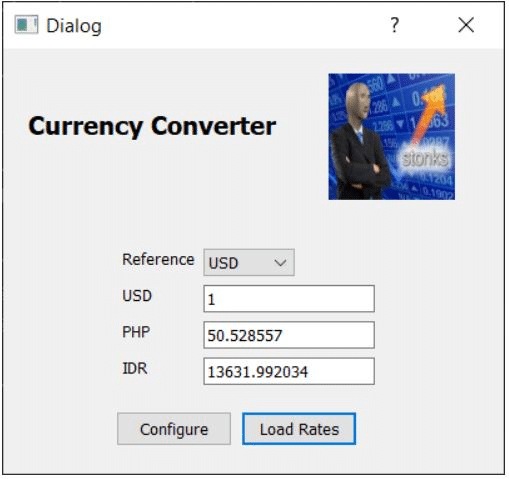
Building a Python GUI with PyQt Designer
An effective Python + PyQt Designer Workflow. Before we begin, it is assumed you have intermediate to advanced knowledge of Python. This…
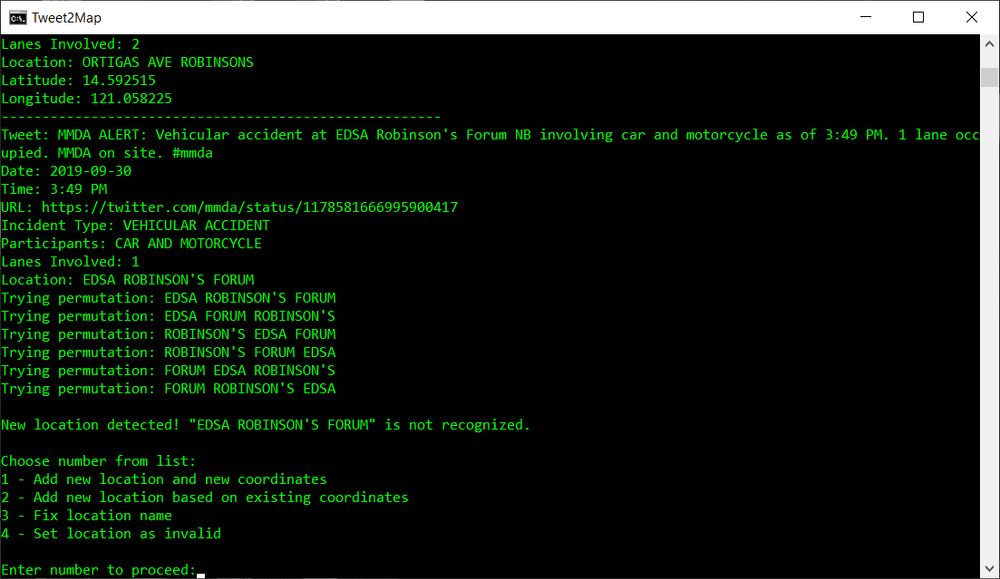
Tweet2Map: Adding a Spellchecker and Permutations
Tweets on the @mmda Twitter page are structured but they are still typed manually. It’s been a year and I’ve noticed small spelling…
Building A Tool To Visualize Spectral Distribution With Scatter Plots
ArcGIS spectral scatter plot (Left) vs. my tool (Right) When you’re working with remote sensing data it really involves looking at a lot…
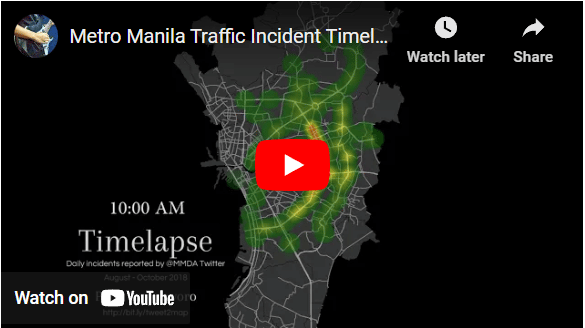
Time-lapse of Daily Incidents in Metro Manila (August-October 2018)
A simple time-lapse video illustrating how the distribution of incidents in Metro Manila change throughout the day. This is a quick post…
Integrating ArcGIS’s ArcPy package with my Tweet2Map script
Note: This is a more technical post focusing on Python, ArcGIS, and arcpy (ArcGIS’s scripting module) I recently updated my MMDA traffic…
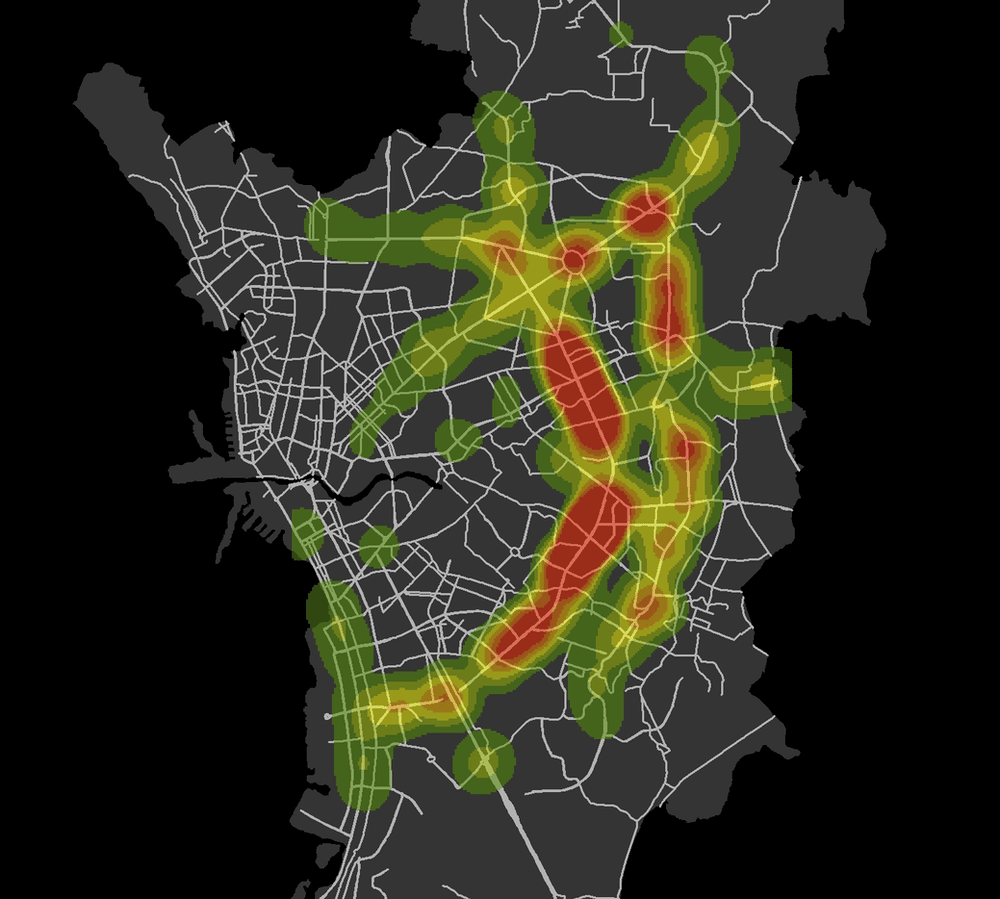
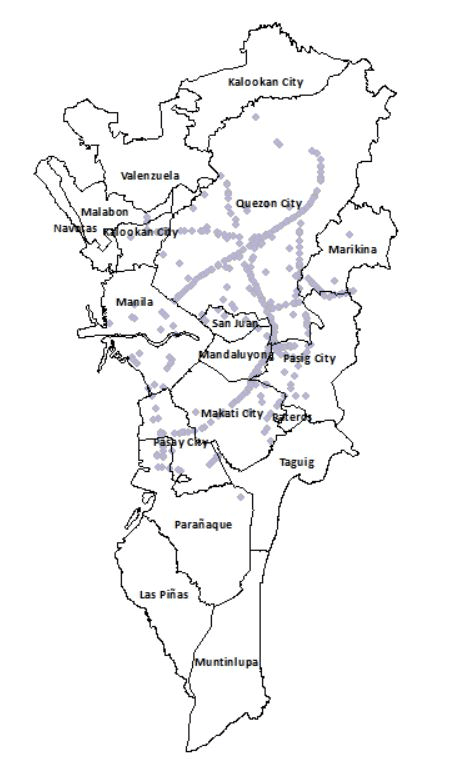
MMDA Twitter Analysis: One Month of Traffic Incidents in Manila
1 month and 1,000 incidents so far in Metro Manila. I’m running my first deep analysis on the data. During the month of September the…

From Twitter to GIS. Visualizing MMDA Accident Data from Twitter
Access the database of Manila traffic incidents from Twitter posts using Python and the Twitter API here. The Metro Manila Development…